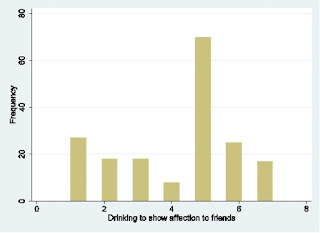
Instead of doing it manually (copy and paste), we can do it much quicker: if you want to save a histogram graph:
1) hist d1, freq
2) graph export d1.eps, replace
3) graphout d1.eps using example.rtf
4) Open file example.rtf, you will see this:
The only problem is that it is not clear as we use Excel.
Always use Excel if the graph is simple. If it is more complicated, use Stata's graphic functions.
1) hist d1, freq
2) graph export d1.eps, replace
3) graphout d1.eps using example.rtf
4) Open file example.rtf, you will see this:
The only problem is that it is not clear as we use Excel.
Always use Excel if the graph is simple. If it is more complicated, use Stata's graphic functions.
